
Well, that was quick! It feels like we just waved goodbye to 2024, and already Q1 2025 is in the rear-view mirror. It’s been a fast and furious start to the year, with political drama, AI getting even smarter and some crazy weather.
But, following the sunniest March on record, it’s time to shine a light on the goings on here at Dealer Auction, as we continue our mission to help dealers stock up on quality vehicles and sell their trade stock for profit. Let’s pause to reflect on how the first quarter shaped up in the fast lane of digital car auctions.
Alerts sent, matches made
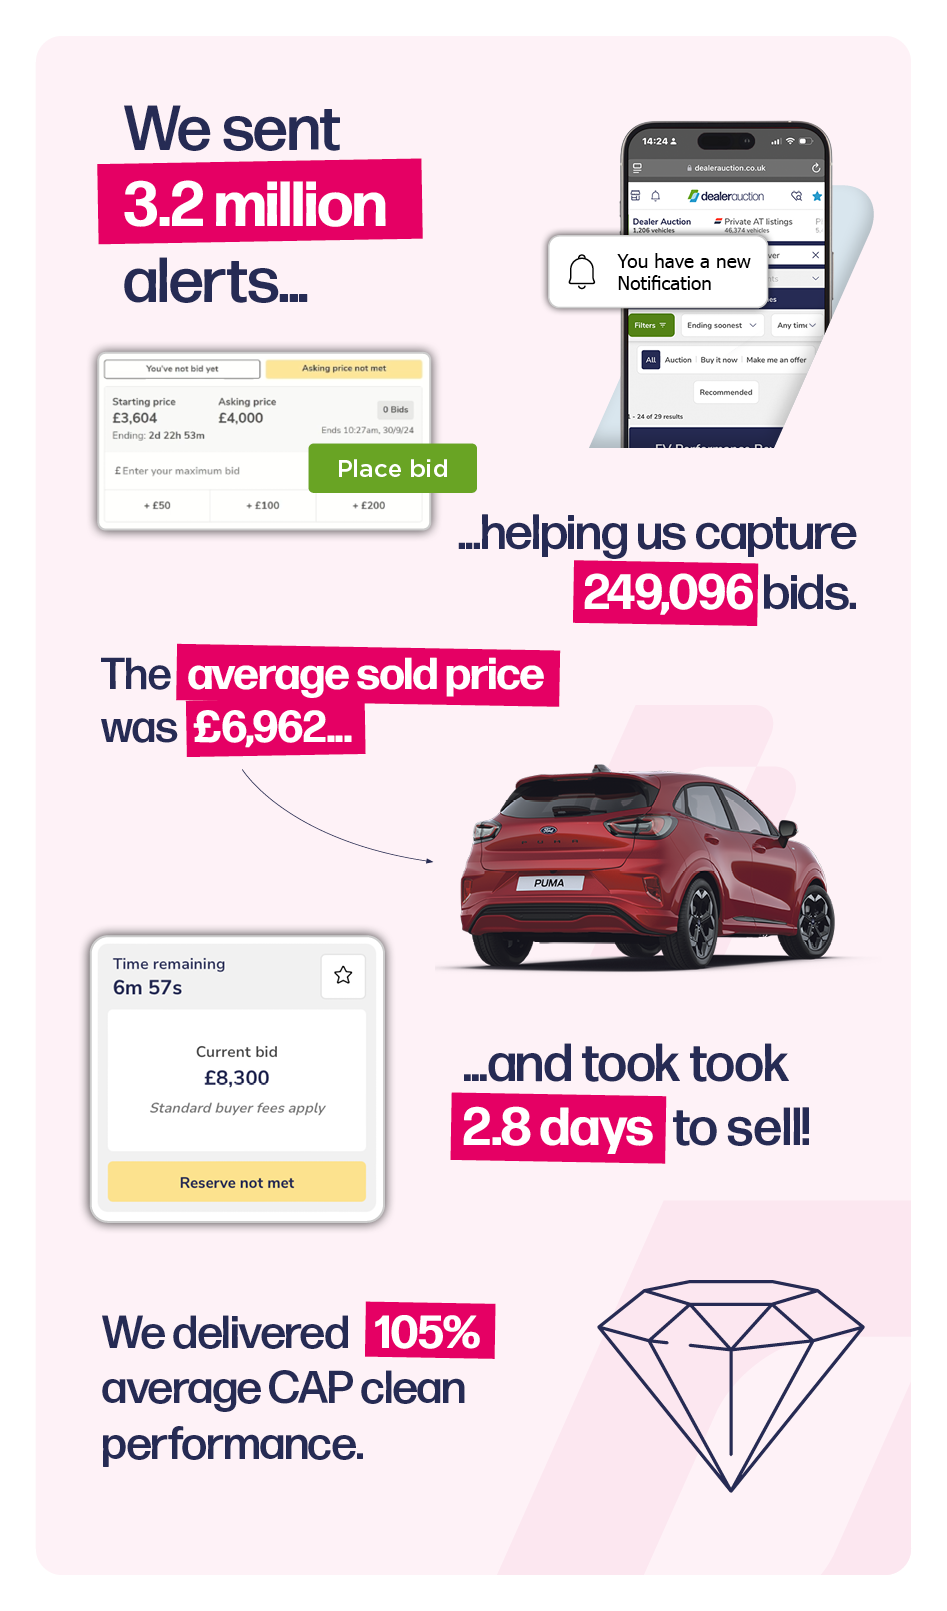
We sent out 3.2 million alerts between 1 January and 31 March 2025, letting dealers know as soon as a match hit the platform. These soaring numbers highlight the increase in our volume of vehicles available, as well as the numbers of buyers flocking to our platform. Our ad views support this – we saw a 17.5% rise in the highest number of views on a vehicle, compared with the same period last year. But did this interest from dealers translate to bids?
Well, with 249,096 bids captured on our platform, it proves once again that the right stock is finding its buyer. The average sold price? A cool £6,962. And this doesn’t include our new retail-ready stock, which has an average vehicle value of £23,500! Didn’t think Dealer Auction had the stock for you? Think again…
Last but certainly not least, our average CAP performance hit 105% – underlining how we continue to deliver a strong performance for dealers.
Did someone say ‘profit’?
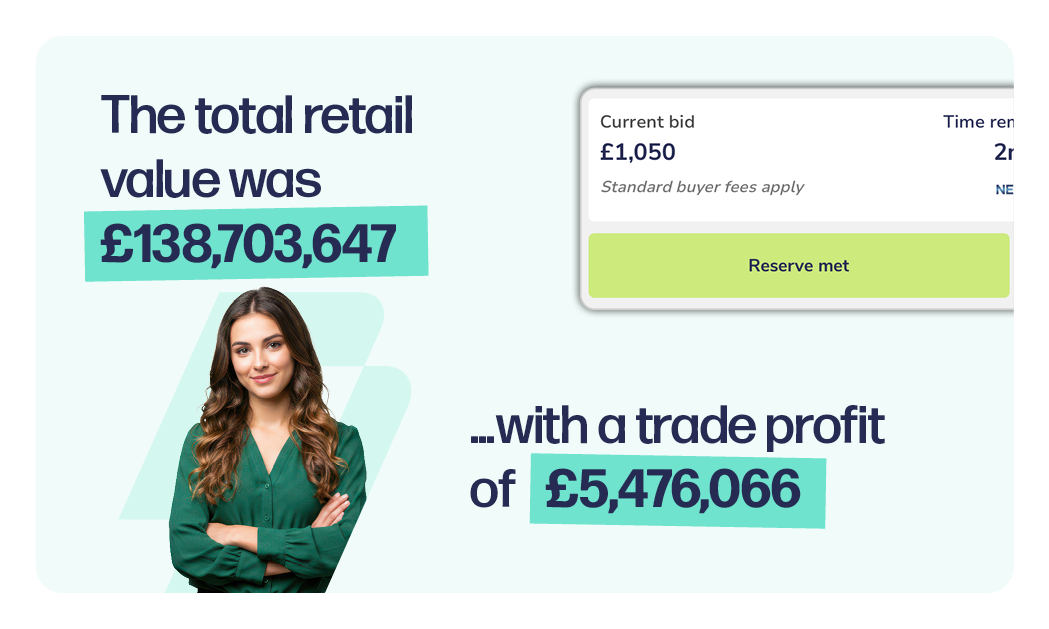
Perhaps the biggest takeaway from Q1 was the total estimated trade profit generated for sellers – a whopping £5.5 million. That’s some serious cash injected back into the market. This is not only 65% up on the same period last year but isn’t far off HALF the total trade profit for 2024 (£13 million) either! The total retail value of vehicles traded through our platform topped £138.7 million.
The young and the restless
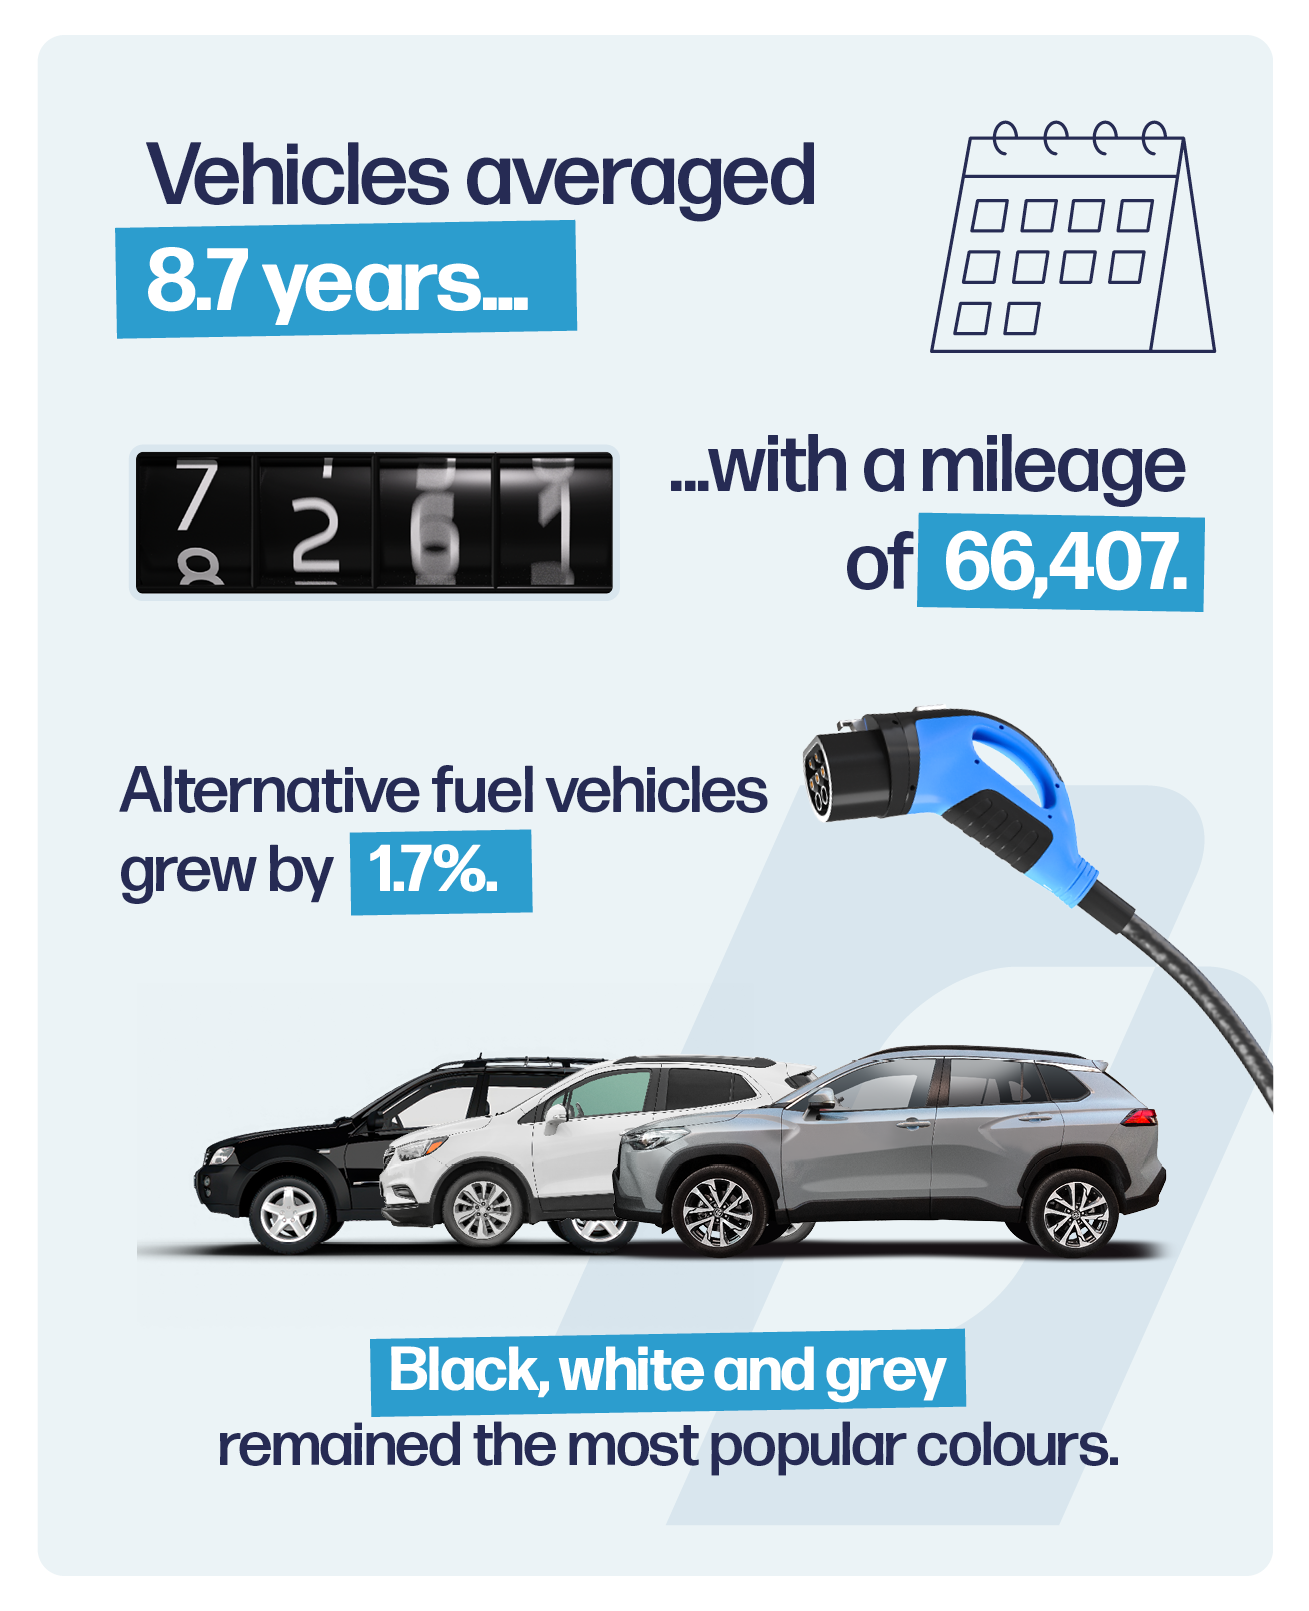
Vehicles moving on our platform in Q1 were slightly younger and carried fewer miles. The average age was 8.7 years, while the average mileage was a respectable 66,407 – so, plenty of road trips, school runs and commutes under their belts, but still ready for more adventures!
When it came to fuel-type breakdown, the percentage of electric stayed consistent, while petrol and diesel lost a slim margin to hybrid (which rose from 5.1% to 6.8%). There was more déjà vu for the most popular colours – black, white and grey – although, notably, blue is snapping at the heels of the top three.
‘KA-P’ performance
It’s certainly worth looking at different performance indicators to make informed, strategic purchases. The Vauxhall Mokka once again topped the league table for CAP Clean performance, but there were some surprise showings – most notably, the Ford KA leaping to second place – could this city supermini pique dealers’ interest further into 2025?
Premium models once again dominated the retail margin chart, with three Land Rover models in the top 5. Looking at the data can not only support you in identifying vehicles that sell well but ones that ultimately provide unique income opportunities too.

Onward to Q2…
So, what’s next? If Q1 is anything to go by, we’re in for another fast-paced, high-energy quarter. More stock, more bids, more success stories. Our mission stays the same: to equip you with extra knowledge and data that can help you convert from your forecourt, so you never miss an opportunity.
The UK’s smartest digital wholesale marketplace
Like what you see? Why not take us for a 30-day test drive…